Know your water risk before the permit hearing does.
AquaSure scores site-level water risk for colocation and hyperscale facilities. Basin stress, drought exposure, hazard risk, and water use intensity, combined into a single 0-10 audit built on federal data, with every input traced back to its source.
Power was the constraint. Water is next.
Siting decisions used to belong to your development team. Now they involve a county commission, a state permitting office, and a hyperscale tenant's RFP questionnaire, and all three of them ask about water. Minnesota created a separate water permitting requirement for data centers. Denver passed a one-year moratorium on new data center zoning permits in May 2026. Most operators find out where a site really stands after the capital is already committed.
A site audit you can hand to a permitting consultant.
Not a dashboard login. A report.
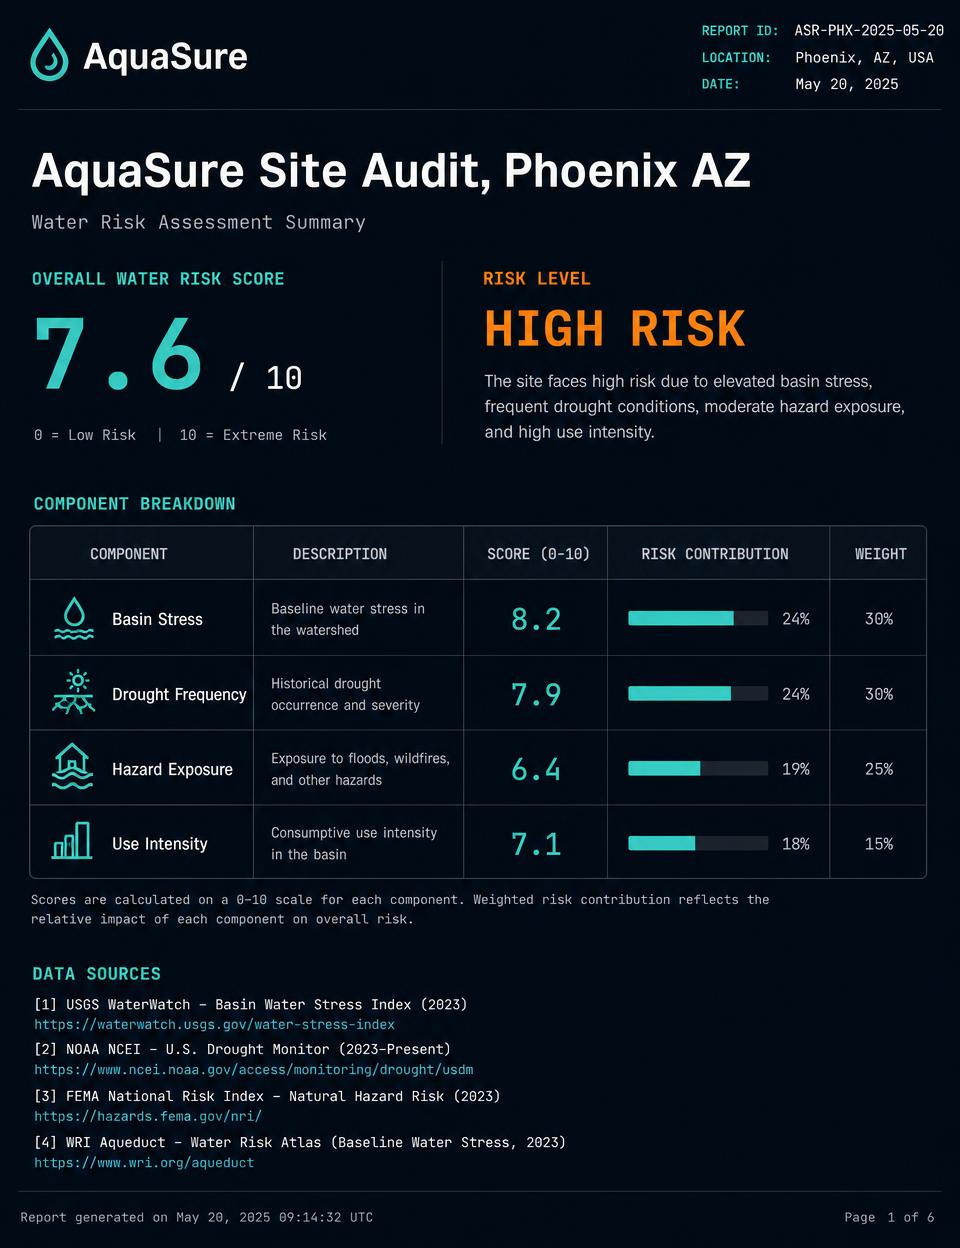
- 01The AquaSure Score.A 0-10 composite with a risk band and a plain-English reading. Phoenix scores differently than Columbus, and the report shows you exactly why.
- 02Component breakdown.Basin stress, drought frequency, hazard exposure, and water use intensity, each scored and weighted on its own.
- 03Source traceability matrix.Every input, its origin dataset, its resolution, and a reliability rating. Nothing hidden.
- 04Comparative siting view.Score multiple candidate sites against each other on the same basis.
- 05Delivered as a PDF.Something you can forward to your board, a tenant, or counsel without anyone needing a login.
How the score works.
A score you can't defend in a hearing is a score you can't use. That's why traceability is a deliverable and not a footnote.
| SOURCE | WHAT IT CONTRIBUTES | RESOLUTION |
|---|---|---|
| USGS | Water withdrawal and availability | County |
| NOAA | Drought frequency and severity | State |
| FEMA National Risk Index | Natural hazard exposure | County |
| WRI Aqueduct | Baseline basin water stress | State |
Resolution reflects current adapter coverage. County-level expansion is in progress.
See a real audit before you talk to us.
A complete Phoenix, Arizona site audit with the full score breakdown, component weights, and the traceability matrix. Generated from live data, not a template.
Built for the people who pick the site.
Questions we get asked.
Send us one site. We'll score it.
Give us coordinates and an expected load profile and you will get back a full audit. The first site is free, so you can judge the output before anything else comes up.